2016年8月6日 星期六
2016年8月3日 星期三
程式交易新利器(僅限於美股) Quantopian
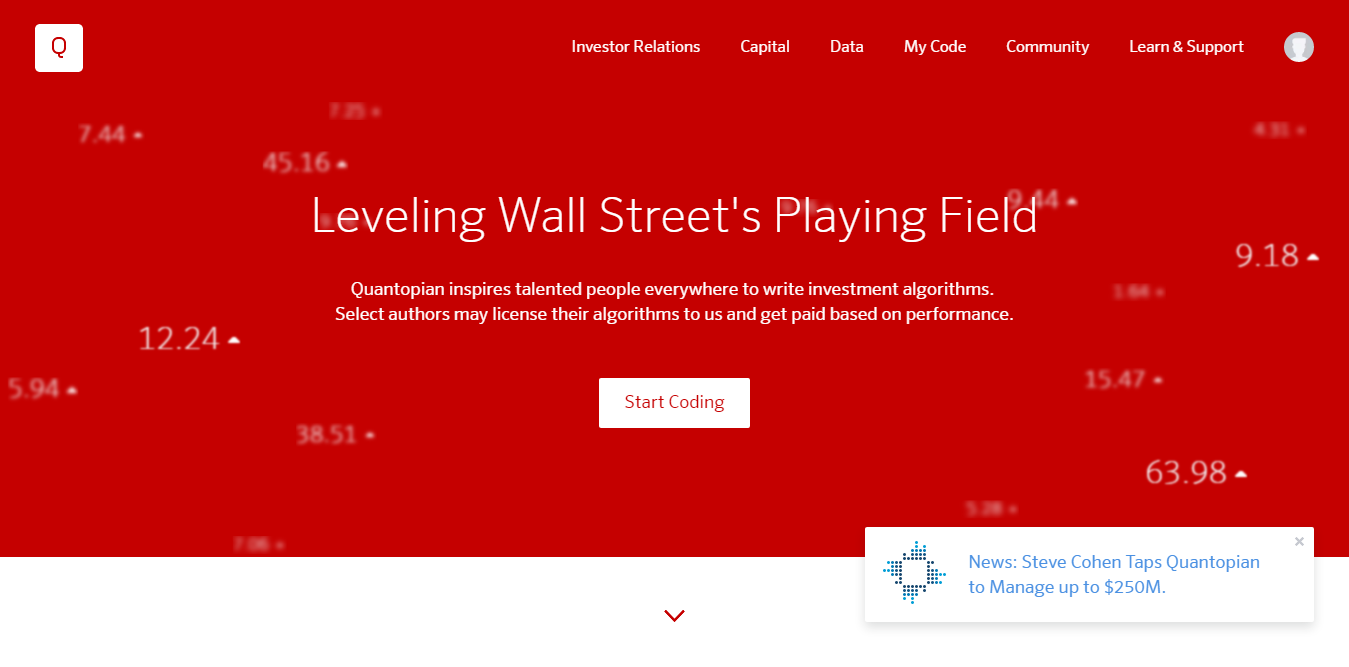
Quantopian (www.quantopian.com) 是一個Python演算法交易開發平台及社群,直接藉由瀏覽器就能操作,只要透過網頁介面的IDE (Integrated Development Environment), 使用者就能開發自己的交易策略。近來更獲得知名投資人Steven Cohen的資金入注。
功能介紹
Quantopian提供兩個主要的功能分為Research及Develop。

2. Develop: 藉由Quantopian提供的IDE,讓使用者可以撰寫交易演算法,使用過去資料進行回測。Quantopian也提供即時數據運算。
Quantopian提供2002到現在的美股 (包括ETF) 資料,價量方面,有開盤價、收盤價、最高價、最低價及交易量,最短頻率可達每分鐘的數據。除此之外,還提供從Morningstar取得之基本面資料。Quantopian也有和 Interactive Brokers及Robinhood券商合作,提供即時交易服務。
相關介紹可進入以下文章
2016年7月18日 星期一
NCR Group (NCR) Analysis Result
NCR
Group (NYSE: NCR)
Date:
07/15/2016
P/E
Ratio: N.A. Fair
Value: $20
Dividend
Yield: N.A. Beta:
1.83
NCR Corp is a technology
company providing products & services enabling businesses to connect,
interact & transact with customer. Its products include ATM & financial
services software, point of sale devices, self-service kiosks & software
applications.

▎Financial Report
Analysis


The financial services segment
accounts for most revenue. From the operating income by segment, we can see
that financial services and hospitality segment have higher operating margin. About
46% of revenue is from U.S. and 31% is from EMEA.


Revenue of NCR group grew
modestly. However, operating income decreased from 2014. From 10K of NCR Group,
it stated that “During 2015, the Company
transferred the UK London pension plan obligations to PIC through the
completion of a buy-out of the pension plan, resulting in a settlement of $427
million in 2015.” The pension expenses caused big influence on cost and
expense. In addition, NCR has not paid cash dividends historically and it state
that NCR group does not anticipate the payment of cash dividends on NCR common
stock in the immediate future.


From DuPont analysis, ROA and
ROE of 2015 are negative due to negative net margin. Asset Turnover didn’t
change much from 2006 to 2015. However, financial leverage is fluctuant along
with the time. TTM of financial leverage achieves almost 15 times. As a result,
NCR group may have financial risk in the future.
▎Valuation: Market Multiples


▎Valuation: Discount Free Cash Flow


▎Comments
To sum up, NCR
group’s financial position doesn’t seem positive in recent years. Management of
NCR indicates that they will develop toward to clouding. However, it didn’t not
show on revenue. I think investor should wait and see whether NCR can change situation
or not.
2016年7月10日 星期日
艾訊 (3088) 分析結果

簡介:
艾訊股份有限公司(代碼:3088.TW) 成立於1990年5月,主要從事嵌入式板卡暨系統產品 (EBS)、設計及製造服務產品 (DMS)、以及乙太網路產品等項目。近年依據工業物聯網 (Industrial Internet of Things, IIoT) 與工業4.0發展趨勢,積極投入工廠自動化、智慧交通,與智慧能源等應用領域。工業電腦大廠研華之持有其25.99%之股權。
十年股價走勢圖:
圖
1 十年股價走勢圖

歷史數據分析:
表
1 歷史數據分析

圖
2 營收狀況

圖
3 獲利狀況

表1及圖2則顯示,艾訊的營業毛利近五年平均約為35%、營業利潤率約為10%、稅後淨利率約為7%,可知除了營收有成長以外,在獲利能力上,也有緩和提升。
圖
4 杜邦分析

杜邦分析法說明股東權益報酬率 (Return on Equity, ROE) 受3類因素影響: (1) 營運效率:用稅後淨利率衡量 (2) 資產使用效率:用總資產週轉率衡量 (3) 財務槓桿:用權益乘數衡量。稅後淨利率是一個綜合性最強的財務分析指標,是此分析系統的核心。稅後淨利率數字越高,表示公司盈利能力及成本控制能力越強;總資產週轉率數字越高,表示公司運用資產提升銷售額的效率越高;權益乘數越高,表示負債越重,財務風險越高。由上表及上圖可知,艾訊的ROE在2011過後,呈現相當程度的成長,而這些成長合理的來自於3類因素,並無財務風險的疑慮。
市場乘數法:
表
2 市場乘數 (工業電腦產業)

本益比 (Price-earnings Ratio, P/E) 說明當股價在低檔但獲利維持在高檔時,本益比偏低暗示這檔個股有逢低買進的投資價值;相反地,當股價飆高但獲利並未跟著成長,本益比偏高表示股價脫離合理價值,應逢高獲利了結。換個角度想,「本益比」也可視為投入成本和每年收益的比例。由表2可發現,艾訊的P/S及P/E都低於產業的平均值,顯示艾訊的股價有被市場低估的情況。
圖
5 艾訊歷史本益比

而從過去艾訊的歷史本益比中,也可以發現,目前的本益比處於低檔的狀況。
現金流量折現法:
表
3 WACC 及 相關計算參數

表
4 現金流量折現法

評論:
綜合以上分析可知,艾訊擁有良好的財務基本面,包括營收及ROE的成長,在自由現金流上,也擁有正向健康的現金流,惟目前市場股價並未反應艾訊之真正價值,建議投資人可以逢低買進。
2016年7月2日 星期六


2015年11月8日 星期日
石油價格下跌,誰受惠?
石油價格走勢

(經過通貨膨脹率調整)
2014年6月30日起,國際油價急轉直下,僅花半年的時間,油價大幅滑落幾近三分之一,時至2015年初,布蘭特(Brent)、西德州(WTI)等主要國際原油價格,都下跌至2009年3月以來的6年低點,自每桶約110美元跌至45美元左右的低價,跌幅高達60.0%以上。未來幾年之內,油價很有可能繼續在低價位徘徊。儘管替代燃料和節能工作頗見成效,但石油仍然是世界經濟的生命泉源,且基本上是惟一可用的交通燃料。因此,油價下跌將對全球經濟和政治產生巨大的影響,然而全球各個國家反應卻會大大不同。
石油價格下跌會造成的影響
對於石油消費國而言,油價下跌不僅可以減低人民生活負擔,效果也等同於減稅。可藉由此機會,達成增加儲蓄、償還債務和增加消費等目標。在大多數國家,消費者將傾向將省下來的錢來增加支出。所以,油價下跌最大的受益者是自身沒有豐富石油資源的國家,例如東歐國家和若干亞洲國家,包括印度、韓國和日本。有些國家的國內石油產量剛好維持自足。這些國家包括阿根廷、埃及和秘魯,油價下跌對整體經濟基本沒有影響。而在產油國中,各國蒙受的影響將會有很大差別,這會取決於三個因素:1)出口的石油產量與國內消費的石油產量之間的比例。2)國家經濟的規模與多樣性。3)可用於滿足國家需求的外匯儲備及其他儲備的數額。中國、英國和美國等產油大國的消費量高於產量,因此油價下跌對這些國家有益無害。其他國家的GDP則會遭受重大打擊,但受益於龐大的外匯儲備和主權財富基金(SWF),可以暫時緩解衝擊。這些國家包括沙烏地阿拉伯、科威特、卡達和阿拉伯聯合大公國等諸多波斯灣國家,以及阿爾及利亞和挪威。相比之下,因油價長期下跌受創最重的淨石油出口國包括安哥拉、亞塞拜然、哥倫比亞、伊朗、伊拉克、哈薩克、利比亞、奈及利亞、阿曼、俄羅斯、委內瑞拉和葉門。相對於經濟產出 (低於GDP的50%) 和油價下跌的負面影響,這些國家的外匯儲備和主權財富基金的資產相較之下實在是微不足道。因此,這些國家的經濟最有可能出現傷害。
數據

上表列出全球前30名石油生產國及石油消耗國,石油生產國前三名為美國、沙烏地阿拉伯、俄羅斯;石油消耗國前三名則為美國、中國、日本。

上表列出全球前30名生產及消耗差距最大之國家,前三名分別為美國、中國、日本,可發現這些國家集中於歐洲及亞洲地區。

上圖則是瑞士銀行的宏觀策略團隊所做的研究,表示不同國家GDP受石油價格永久下降$10美元的影響,可發現俄羅斯、OPEC國家、挪威等國家會受到嚴重不利的影響,而菲律賓、泰國、南非等國家,則有正面影響。
可投資標的
可利用指數股票型基金 (ETF) 這種低成本、多種類的金融商品來追蹤受利於油價下跌國家之指數,例如追蹤印度的iShares
MSCI India (INDA)、EGShares India
Consumer ETF (INCO);菲律賓iShares MSCI
Philippines (EPHE);亞太新興國家SPDR® S&P
Emerging Asia Pacific ETF (GMF);歐洲Vanguard FTSE
Europe ETF (VGK)等。
資料來源:
http://www.cmegroup.com/cn-t/edu/files/tc-geopolitical%20economic%20consquences%20of%20oil%20collapse.pdf
http://www.businessinsider.com/ubs-gdp-impact-of-10-decline-in-oil-2014-12
http://news.morningstar.com/etf/Lists/ETFReturns.html
http://www.macrotrends.net/1369/crude-oil-price-history-chart
http://www.eia.gov/beta/international/
2015年10月11日 星期日
American Express (AXP) Analysis --- I
Company Overview
American
Express’s principal products and services are charge and credit payment card
products and travel-related services offered to consumers and businesses around
the world. They are principally engaged in businesses comprising
four reportable operating segments: U.S. Card Services, International Card
Services, Global Commercial Services and Global Network & Merchant Services. They compete
in the global payments industry with charge[1], credit
and debit card networks, issuers and acquirers, as well as evolving alternative
payment providers. As the payments industry continues to evolve, American
Express is facing increasing competition from non-traditional players that
leverage new technologies and customers’ existing accounts and relationships to
create payment or other fee-based solutions.
2015年10月4日 星期日
Eli Lilly Analysis --- III
Valuation
Market Approach


Current
Eli Lilly’s multiples are higher than industry average and historical data. It means
that Eli Lilly’s stock price is overvalued now.
Income Approach


FCFF
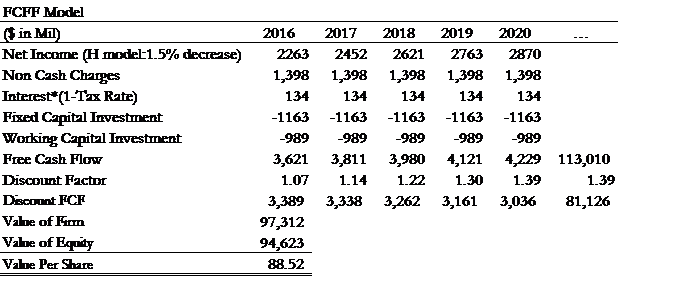
Model indicates the intrinsic value of Eli Lilly is $88.52 per share which is
almost the same as current price $87.52(5015/10/02). It suggests investors
should hold Eli Lilly until further information is available.
Historical Stock Price

Source:
Data are from Morningstar if not specified.
2015年9月11日 星期五
Eli Lilly Analysis --- II
1. Fundamental Financial Data
Eli Lilly's
Free Cash Flow
|
||||||||||
USD Mil
|
2005
|
2006
|
2007
|
2008
|
2009
|
2010
|
2011
|
2012
|
2013
|
2014
|
Operating
Cash Flow
|
1914
|
3976
|
5155
|
7296
|
4336
|
6857
|
7235
|
5305
|
5735
|
4367
|
Cap Spending
|
-1298
|
-1078
|
-1082
|
-947
|
-855
|
-1187
|
-1693
|
-1044
|
-1093
|
-1471
|
Free Cash
Flow
|
616
|
2898
|
4072
|
6348
|
3481
|
5670
|
5542
|
4261
|
4642
|
2896
|
Free Cash
Flow/Sales
|
4.2
|
18.47
|
21.85
|
31.15
|
15.94
|
24.57
|
22.82
|
18.85
|
20.08
|
14.76
|
Eli Lilly's
Profitability Numbers
|
||||||||||
2005
|
2006
|
2007
|
2008
|
2009
|
2010
|
2011
|
2012
|
2013
|
2014
|
|
Operating
Margin
|
24.91
|
26.29
|
21.77
|
3.4
|
25.59
|
28.3
|
22.76
|
23.93
|
23.24
|
16.97
|
Net Margin
|
13.52
|
16.97
|
15.85
|
-10.17
|
19.82
|
21.97
|
17.9
|
18.09
|
20.27
|
12.19
|
Asset
Turnover
|
0.59
|
0.67
|
0.76
|
0.73
|
0.77
|
0.79
|
0.75
|
0.66
|
0.66
|
0.54
|
Return on
Assets
|
8.01
|
11.44
|
12.12
|
-7.4
|
15.28
|
17.34
|
13.45
|
12.01
|
13.45
|
6.6
|
Financial Leverage
|
2.28
|
2
|
1.96
|
4.34
|
2.88
|
2.5
|
2.49
|
2.33
|
2
|
2.42
|
Return on
Equity
|
18.24
|
24.46
|
23.96
|
-20.31
|
53.25
|
46.2
|
33.49
|
28.89
|
28.92
|
14.49
|
Eli Lilly's
Revenue Growth
|
||||||||||
2005
|
2006
|
2007
|
2008
|
2009
|
2010
|
2011
|
2012
|
2013
|
2014
|
|
Year over Year
|
5.68
|
7.14
|
18.75
|
9.36
|
7.15
|
5.68
|
5.25
|
-6.93
|
2.26
|
-15.13
|
3-Year
Average
|
9.75
|
7.64
|
10.37
|
11.64
|
11.65
|
7.39
|
6.02
|
1.16
|
0.05
|
-6.87
|
10-Year
Average
|
8.03
|
7.88
|
8.14
|
8.23
|
8.12
|
7.83
|
7.72
|
7.39
|
6.27
|
3.54
|
Facing a very steep patent cliff in 2014, Eli
Lilly got a pretty low ROA and ROE comparing previous year. In addition, Eli Lilly confronted lowest YOY revenue growth rate. However,
the good news is Eli Lilly had a stable positive free cash flow in past ten
years.
2. Segment
Sales


Eli
Lilly’s largest portion of revenue is from Endocrinology drugs followed by
Neuroscience drugs and Oncology drugs. Animal health segment had a better
profit margin comparing to human pharmaceutical products.
3. Industry
Overview


Eli Lilly’s gross profit is higher than
industry average. However, its profit margin didn’t higher than industry
average. The reason is that Eli Lilly tends to spend over 20% of its sales on R&D,
much higher than the industry average. Before 2014, Eli Lilly’s ROA and ROE are
higher than industry average. However, it’s ROA and ROE in 2014 are much lower
than industry average.
Reference: Data from Morningstar.com and Eli Lilly's annual report
Reference: Data from Morningstar.com and Eli Lilly's annual report