顯示具有 美股 標籤的文章。 顯示所有文章

2016年8月3日 星期三

程式交易新利器(僅限於美股) Quantopian

8/03/2016 05:55:00 下午 Posted by Unknown , , No comments
Quantopian (www.quantopian.com) 是一個Python演算法交易開發平台及社群,直接藉由瀏覽器就能操作,只要透過網頁介面的IDE (Integrated Development Environment), 使用者就能開發自己的交易策略。近來更獲得知名投資人Steven Cohen的資金入注。

01.png
功能介紹
Quantopian提供兩個主要的功能分為Research及Develop。
02.png
1. Research: 藉由Quantopian提供的IPython Notebook環境,讓使用者可以分析及研究資料。
2. Develop: 藉由Quantopian提供的IDE,讓使用者可以撰寫交易演算法,使用過去資料進行回測。Quantopian也提供即時數據運算。

Quantopian提供2002到現在的美股 (包括ETF) 資料,價量方面,有開盤價、收盤價、最高價、最低價及交易量,最短頻率可達每分鐘的數據。除此之外,還提供從Morningstar取得之基本面資料。Quantopian也有和 Interactive Brokers及Robinhood券商合作,提供即時交易服務。

相關介紹可進入以下文章

2016年7月18日 星期一

NCR Group (NCR) Analysis Result

7/18/2016 11:50:00 下午 Posted by Unknown , , No comments
NCR Group (NYSE: NCR)      
Date: 07/15/2016

Last Close Price: $30.47                            Market Cap: $ 3.8 bil
P/E Ratio: N.A.                                        Fair Value: $20
Dividend Yield: N.A.                                Beta: 1.83 
Basic Description
NCR Corp is a technology company providing products & services enabling businesses to connect, interact & transact with customer. Its products include ATM & financial services software, point of sale devices, self-service kiosks & software applications. 

Historical Stock Prices

Financial Report Analysis


The financial services segment accounts for most revenue. From the operating income by segment, we can see that financial services and hospitality segment have higher operating margin. About 46% of revenue is from U.S. and 31% is from EMEA.

Revenue of NCR group grew modestly. However, operating income decreased from 2014. From 10K of NCR Group, it stated that “During 2015, the Company transferred the UK London pension plan obligations to PIC through the completion of a buy-out of the pension plan, resulting in a settlement of $427 million in 2015.” The pension expenses caused big influence on cost and expense. In addition, NCR has not paid cash dividends historically and it state that NCR group does not anticipate the payment of cash dividends on NCR common stock in the immediate future.


From DuPont analysis, ROA and ROE of 2015 are negative due to negative net margin. Asset Turnover didn’t change much from 2006 to 2015. However, financial leverage is fluctuant along with the time. TTM of financial leverage achieves almost 15 times. As a result, NCR group may have financial risk in the future.
Valuation: Market Multiples 


Valuation: Discount Free Cash Flow

Comments
To sum up, NCR group’s financial position doesn’t seem positive in recent years. Management of NCR indicates that they will develop toward to clouding. However, it didn’t not show on revenue. I think investor should wait and see whether NCR can change situation or not.


2016年6月25日 星期六

2015年10月11日 星期日

American Express (AXP) Analysis --- I

10/11/2015 08:20:00 下午 Posted by Unknown , , No comments

Company Overview

American Express’s principal products and services are charge and credit payment card products and travel-related services offered to consumers and businesses around the world. They are principally engaged in businesses comprising four reportable operating segments: U.S. Card Services, International Card Services, Global Commercial Services and Global Network & Merchant Services. They compete in the global payments industry with charge[1], credit and debit card networks, issuers and acquirers, as well as evolving alternative payment providers. As the payments industry continues to evolve, American Express is facing increasing competition from non-traditional players that leverage new technologies and customers’ existing accounts and relationships to create payment or other fee-based solutions.

2015年10月4日 星期日

Eli Lilly Analysis --- III

10/04/2015 10:51:00 下午 Posted by Unknown , , No comments

Valuation

Market Approach


Current Eli Lilly’s multiples are higher than industry average and historical data. It means that Eli Lilly’s stock price is overvalued now. 

Income Approach


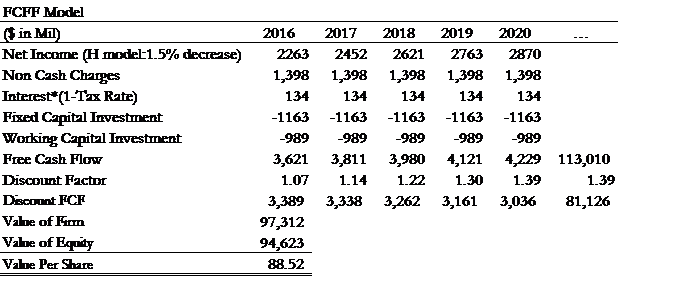
FCFF Model indicates the intrinsic value of Eli Lilly is $88.52 per share which is almost the same as current price $87.52(5015/10/02). It suggests investors should hold Eli Lilly until further information is available. 

Historical Stock Price


Source: Data are from Morningstar if not specified.

2015年9月11日 星期五

Eli Lilly Analysis --- II

9/11/2015 12:11:00 上午 Posted by Unknown , , No comments

1.  Fundamental Financial Data

Eli Lilly's Free Cash Flow
USD Mil
2005
2006
2007
2008
2009
2010
2011
2012
2013
2014
Operating Cash Flow
1914
3976
5155
7296
4336
6857
7235
5305
5735
4367
Cap Spending
-1298
-1078
-1082
-947
-855
-1187
-1693
-1044
-1093
-1471
Free Cash Flow
616
2898
4072
6348
3481
5670
5542
4261
4642
2896
Free Cash Flow/Sales
4.2
18.47
21.85
31.15
15.94
24.57
22.82
18.85
20.08
14.76

Eli Lilly's Profitability Numbers
 
2005
2006
2007
2008
2009
2010
2011
2012
2013
2014
Operating Margin
24.91
26.29
21.77
3.4
25.59
28.3
22.76
23.93
23.24
16.97
Net Margin
13.52
16.97
15.85
-10.17
19.82
21.97
17.9
18.09
20.27
12.19
Asset Turnover
0.59
0.67
0.76
0.73
0.77
0.79
0.75
0.66
0.66
0.54
Return on Assets
8.01
11.44
12.12
-7.4
15.28
17.34
13.45
12.01
13.45
6.6
Financial Leverage
2.28
2
1.96
4.34
2.88
2.5
2.49
2.33
2
2.42
Return on Equity
18.24
24.46
23.96
-20.31
53.25
46.2
33.49
28.89
28.92
14.49

Eli Lilly's Revenue Growth
 
2005
2006
2007
2008
2009
2010
2011
2012
2013
2014
Year over Year
5.68
7.14
18.75
9.36
7.15
5.68
5.25
-6.93
2.26
-15.13
3-Year Average
9.75
7.64
10.37
11.64
11.65
7.39
6.02
1.16
0.05
-6.87
10-Year Average
8.03
7.88
8.14
8.23
8.12
7.83
7.72
7.39
6.27
3.54

Facing a very steep patent cliff in 2014, Eli Lilly got a pretty low ROA and ROE comparing previous year. In addition, Eli Lilly confronted lowest YOY revenue growth rate. However, the good news is Eli Lilly had a stable positive free cash flow in past ten years.


2.  Segment Sales


Eli Lilly’s largest portion of revenue is from Endocrinology drugs followed by Neuroscience drugs and Oncology drugs. Animal health segment had a better profit margin comparing to human pharmaceutical products.

3.  Industry Overview


Eli Lilly’s gross profit is higher than industry average. However, its profit margin didn’t higher than industry average. The reason is that Eli Lilly tends to spend over 20% of its sales on R&D, much higher than the industry average. Before 2014, Eli Lilly’s ROA and ROE are higher than industry average. However, it’s ROA and ROE in 2014 are much lower than industry average.

Reference: Data from Morningstar.com and Eli Lilly's annual report